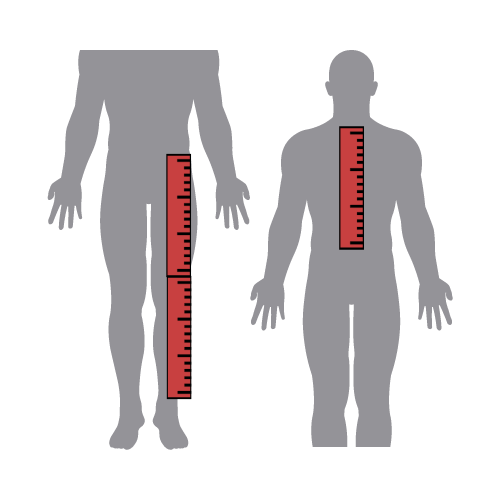
Leg to body ratio (LTB):
The average leg to body ratio (LTB) is 0.491. Women have a higher LTB than men.
Table of Contents
Why this measurement exists
Leg-to-body ratio is one of the few body proportions essentially fixed by adulthood — it reflects the conditions during which your skeleton developed in childhood. That makes it more interesting as a developmental marker than as a fitness metric. Average values cluster tightly across populations, so even small deviations stand out.
How leg-to-body ratio is calculated
The standard formula (used by this calculator) expresses leg length as a fraction of total body height:
LTB = (Height − Torso Length) ÷ Height
Where Torso Length is measured from the crown of the head to the top of the pelvis (or the seat surface when sitting upright).
Worked example using the calculator's defaults (178 cm height, 90 cm torso):
- Leg length = 178 − 90 = 88 cm
- LTB = 88 ÷ 178 = 0.494
That's right around the population average. Note that some sources define LTB as leg length divided by torso length (88/90 = 0.978 in this example), giving values typically around 1.10–1.20. Same proportions, different scale — check which convention any reference is using before comparing.
How to measure torso length correctly
The accuracy of your LTB depends almost entirely on getting the torso length right — height is straightforward, but where exactly the torso "ends" varies by method. The most reproducible approach:
- Sit upright on a hard, flat surface (no cushion) with your back fully against a wall.
- Measure from the crown of your head (highest point) down to the seat surface. This is your sitting height, used interchangeably with torso length in most LTB calculations.
- Subtract from standing height to get leg length, then divide by standing height.
Other methods (measuring from the top of the head to the symphysis pubis, or to the greater trochanter of the femur) give slightly different numbers but the same general picture. The key is consistency — use the same method each time if you're comparing values.
Average values and what they mean
Across most populations of European, African, and East Asian descent, the average adult LTB (leg/height definition) clusters around 0.48–0.53:
| LTB value | Interpretation |
|---|---|
| Below 0.45 | Short legs relative to torso (about 1 in 6 adults) |
| 0.45 – 0.49 | Below-average proportion |
| 0.49 – 0.53 | Population average range (most adults fall here) |
| 0.53 – 0.57 | Above-average proportion |
| Above 0.57 | Notably long legs (modeling and athletics overrepresent here) |
Women have very slightly higher average LTB than men of the same height, by about 0.5–1%. Populations of West African descent tend to have higher average LTB than European populations; East Asian averages tend to be slightly lower — reflecting differences in skeletal proportions developed over generations.

Health correlations and what they actually mean
Longer leg length (not LTB specifically, but the absolute leg measurement) has been associated in research with:
- Lower risk of cardiovascular disease (Gunnell et al. 1998; Davey Smith et al. 2001) — observed in large UK cohort studies.
- Lower risk of type 2 diabetes (Asao et al. 2006) — statistically significant after controlling for height.
- Reduced all-cause mortality in several long-running cohort studies.
Crucially, the relationship appears to be a marker of childhood nutrition and growth conditions, not a direct effect. Children with adequate nutrition and reduced infection burden during their growth years tend to grow more leg length (the leg long bones continue growing later than the spine). The same favorable childhood conditions also correlate with better adult health. The leg length isn't causing the lower disease risk; both are downstream of childhood developmental conditions.
Aesthetic context and the Golden Ratio
Mathematicians and artists have long looked for ideal human proportions. The Golden Ratio (approximately 1:1.618) appears in classical anatomical references like Leonardo da Vinci's Vitruvian Man, and modern psychology studies have shown that human raters tend to prefer leg-to-torso ratios slightly above population average when judging photographs.
That said, the research on attractiveness preferences shows mostly small effect sizes and significant cultural variation. The Golden Ratio is more useful as a design heuristic than as a literal target for body proportions — and unlike body fat or muscle mass, you can't change your LTB through training or diet.
Sources & references
- Gunnell DJ et al. (1998). "Childhood leg length and adult mortality." Journal of Epidemiology & Community Health 52(3): 142–152.
- Davey Smith G et al. (2001). "Leg length, insulin resistance, and coronary heart disease risk." Journal of Epidemiology & Community Health 55(12): 867–872.
- Asao K et al. (2006). "Leg length and type 2 diabetes." Diabetes Care 29(7): 1632–1637.
- NIH NCBI — Body proportion measures and health outcomes — comprehensive review of body proportion measurements as health indicators.
FAQs
There's no single universal standard, which is why "leg length" measurements vary across studies. The most common convention is to measure torso length from the top of the head to the top of the symphysis pubis (the front of the pelvis where it meets between the legs). Some methods use the seat bone or the hip joint. For consistency, this calculator's torso length should be measured sitting upright on a hard surface: from the crown of your head to the seat surface.
Some research suggests yes, with caveats. Population studies (notably Gunnell et al. 1998 in the UK and several follow-ups) found longer leg length correlates with lower cardiovascular disease risk, lower diabetes risk, and reduced mortality. The leading hypothesis is that leg length is partly a marker of childhood nutrition and growth conditions — people whose legs grew well had healthier developmental years overall. The ratio itself isn't causing the health effect; it's reflecting it.
No, not meaningfully. Long bone growth ends when the growth plates fuse, typically by age 16–18 for girls and 18–21 for boys. After that point, your leg length is essentially fixed. Posture improvements can change apparent height by a centimeter or two (uncoiling spinal compression), but this affects torso length, not leg length. The ratio you have at adulthood is the ratio you have.
Two definitions coexist. The first (used by this calculator) is leg length divided by total height, giving values around 0.49–0.53. The second is leg length divided by torso length, giving values around 1.10–1.20. They describe the same proportions but on different scales. When comparing your number to published averages, check which definition the source uses — otherwise you'll think you're an outlier when you're not.
BMI captures weight relative to height; waist-to-height ratio captures fat distribution; leg-to-body ratio captures skeletal proportions set during childhood growth. They measure different things. For ongoing health monitoring, waist-to-height ratio is far more useful because it changes with diet and exercise. Leg-to-body ratio is essentially fixed, more interesting as a marker of childhood development than as an actionable health metric.